Georgetown University released the results from its first cultural climate survey April 16, providing an assessment of the campus environment and undergraduate students’ experiences with issues such as diversity and inclusion.
The survey, which took place between Feb. 24, 2020, and April 24, 2020, included questions about institutional diversity, sense of belonging, student support and university responsiveness to student needs. The results of the survey are divided into reports for undergraduate and graduate or professional programs. For coverage of The Hoya’s takeaways about the graduate student experience, please reference this article.
Of the 6,636 undergraduate students invited to participate in the survey, 2,465 responded, yielding a 37% response rate. The findings were compared with results provided by the National Institute for Transformation and Equity, the organization that developed the questionnaire Georgetown’s survey was based on.
Here’s what you should know about the results.
“Cultural Relevance:”
The survey found that a higher portion of White students believed that cultural relevance, the extent to which campus environments reflect and value students’ own cultural communities, backgrounds and identities, at Georgetown was sufficient compared to students of other racial and ethnic groups.
- While 74.9% of White students agreed or strongly agreed that there were enough opportunities at Georgetown to interact with students of shared cultural backgrounds, only 64.7% of Asian students agreed, followed by 57.7% of international students, 55% of multiracial students, 52.3% of Hispanic/Latinx students and 49.6% of Black/African American students.
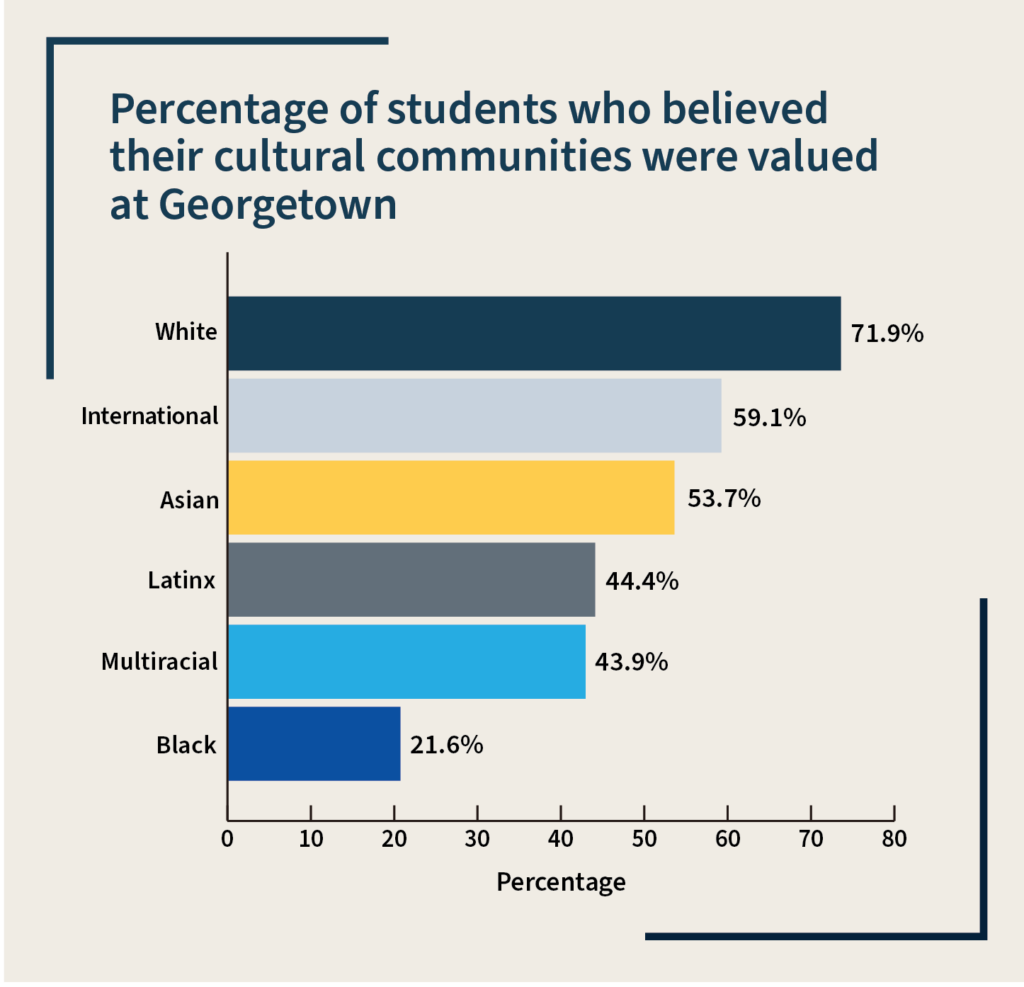
- Of the White students surveyed, 71.9% responded that they believed their cultural communities were valued at Georgetown, followed by 59.1% of international students, 53.7% of Asian students, 44.4% of Hispanic/Latinx students, 43.9% of multiracial students and 21.6% of Black/African American students.
- There is a statistically significant difference between the response of White students in comparison to other students and between Black/African American students in comparison to other students.
“Cultural Responsiveness”: Responding to diverse student needs and offering support
The survey reported a significant difference in the perception of the university’s responsiveness to the needs of diverse students between racial and ethnic groups.
- While 71.8% of White students agreed or strongly agreed that members of the Georgetown community supported one another, 68.2% of Asian students agreed, followed by 65.5% of multiracial students, 62.2% of international students, 59.4% of Hispanic/Latinx students and 35.8% of Black/African American students.
“College Experience”: Student experiences when first entering Georgetown
Students were also asked about their college experiences compared to when they first came to Georgetown, and about their satisfaction with college experience. For many of these questions, Georgetown’s results differed significantly from the NITE-reported results.
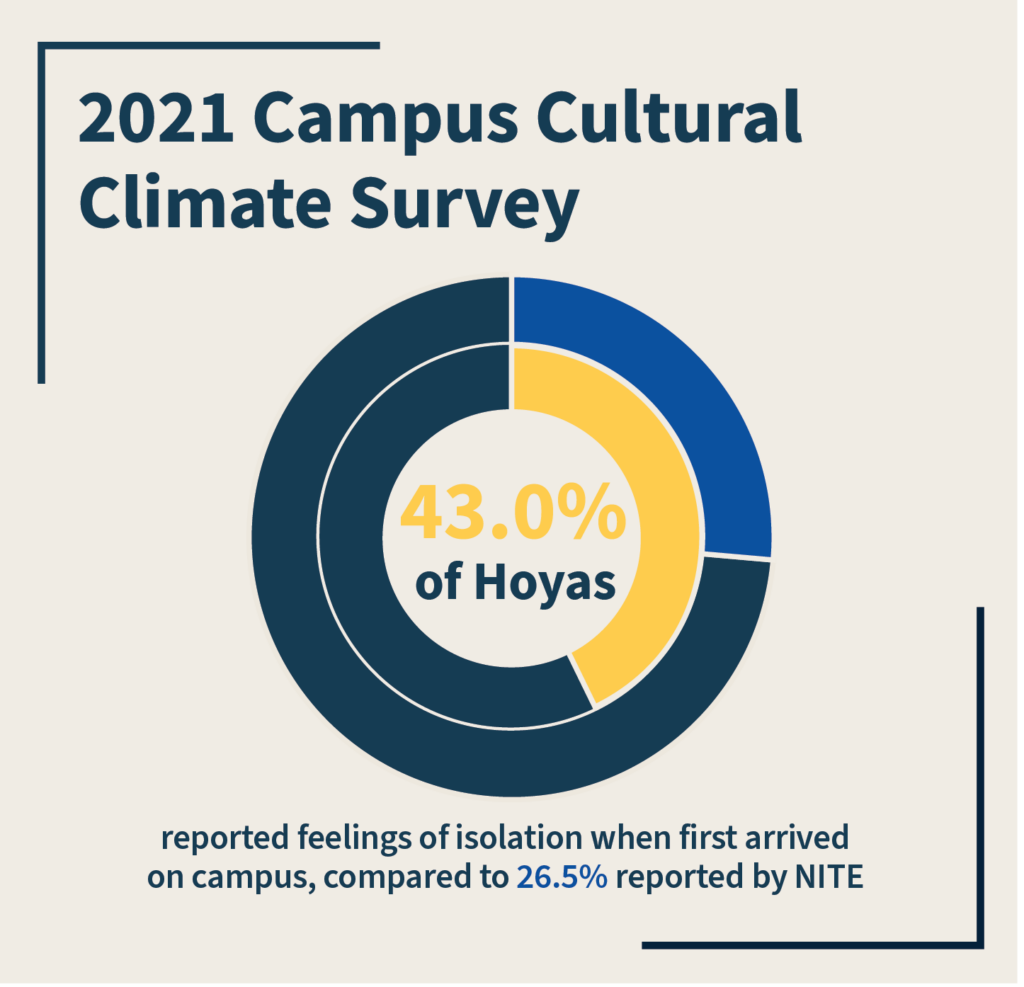
- Of the Georgetown students surveyed, 43% reported they often or always felt isolated when they first arrived at Georgetown, compared to 26.5% reported by NITE.
- Of this group, 57.5% identified as Black/African American, 54.0% as Hispanic/Latinx, 47.3% as multiracial, 41.7% as Asian, 39.9% as White and 39.7% as international.
- Of the undergraduates surveyed, 70.4% said they felt like they were part of the Georgetown community when they first arrived, compared to 63.4% reported by NITE.
- Of the White students surveyed, 76% said they felt like part of the community, followed by 68.6% of international students, 67.8% of Asian students, 64.4% of multiracial students, 62.1% of Hispanic/Latinx students and 43.3% of Black/African American students.
- A total of 74.7% of undergraduates reported satisfaction with their college experience at Georgetown, slightly lower than the NITE average of 77.3%. However, only 47.5% of Black/African American students reported satisfaction, compared to 81.1% of White students, followed by 72.3% of multiracial students, 72% of international students, 70.5% of Asian students and 64.1% of Hispanic/Latinx students.
“Institutional Diversity”: Safety, prejudice, discrimination and commitment to diversity
Students were surveyed about their experience with discrimination, campus safety and the university’s commitment to diversity and responsiveness. In general, Black/African American students and Hispanic/Latinx students reported more prejudice and found less welcome classroom environments, according to the results.
- Of all undergraduate students, 11.3% responded that they always or often experienced prejudice at Georgetown. Broken down by race, this 11.3% includes 37.5% of Black/African American students, 19.9% of Hispanic/Latinx students, 14.4% of international students, 14.1% of multiracial students, 13.9% of Asian students and 5.7% of White students.
- Of the undergraduate students surveyed, 23.6% agreed or strongly agreed that Georgetown effectively responded to incidents of bias, while 24.4% said the same for incidents of discrimination.
- Of the undergraduate students surveyed, 34.4% said that a faculty or staff member often or always did something that showed they cared about students. This percentage is 38.4% among multiracial students, followed by 36.1% of White students, 35% of international students, 31.2% of Asian students, 30.6% of Black/African American students and 26.6% of Hispanic/Latinx students.
- Of the undergraduate students surveyed, 70.4% agreed or strongly agreed that instructors were effective in creating environments in which the students felt welcomed. This percentage is 79.1% among White students, followed by 68.5% of multiracial students, 63.5% of Asian students, 62% of international students, 56.6% of Hispanic/Latinx students and 37.4% of Black/African American students.
- There is a statistically significant difference between the responses of Black/African American students compared to all other groups, as well as between White students and their Asian, Hispanic/Latinx and international peers.
“Georgetown-specific topics and issues”
The survey asked students about issues specific to Georgetown, including encounters with police, campus facilities and accessibility, student services, food options and affordability and documentation status.
- Of the undergraduate students surveyed, 7% report having been stopped and questioned by the Georgetown University Police Department. Broken down by race, this percentage includes 15.8% of Black/African American students, 9.4% of Hispanic/Latinx students, 8.6% of multiracial students, 6.4% of Asian students, 6% of White students and 4.8% of international students.
- There is a statistically significant difference between Black/African American students and their White and international peers.
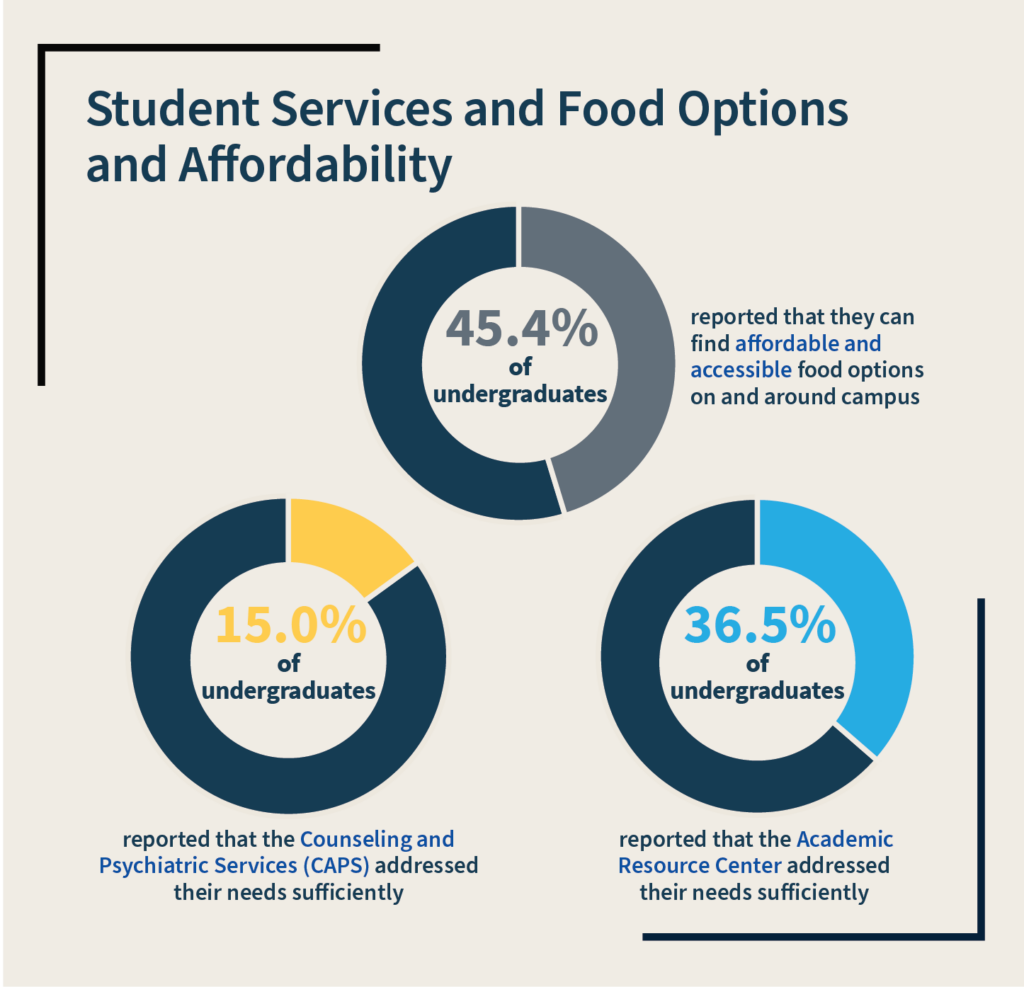
- Of the undergraduate students surveyed, 15% reported that the Counseling and Psychiatric Service (CAPS) addressed their needs sufficiently.
- Of the undergraduates surveyed, 36.5% reported that the Academic Resource Center addressed their needs sufficiently. Broken down by race, this includes 40.6% of White students, followed by 37% of multiracial students, 35.9% of international students, 34.4% of Black/African American students, 32.2% of Hispanic/Latinx students and 21.6% of Asian students.
- There is a statistically significant difference between White and Asian student responses.
- Of the undergraduate students surveyed, 45.4% reported that they can find affordable and accessible food options on and around campus, while 58% of undergraduate students reported that they can find food options on campus that fit the standards of their religious and dietary restrictions.
- Of the undergraduate students surveyed, 7.5% reported that they had experienced threats or harassment due to their documentation status. This percentage is 18.9% among international students, followed by 12.3% of Hispanic/Latinx students and 3.1% of White students.